Split Payment Analysis: What makes people use Split Payment services and how do they behave?
How many people use them?
Out of 268 respondents in my sample, 200 people of different ages, incomes, and backgrounds have used and are using split payment options (75% of the sample).
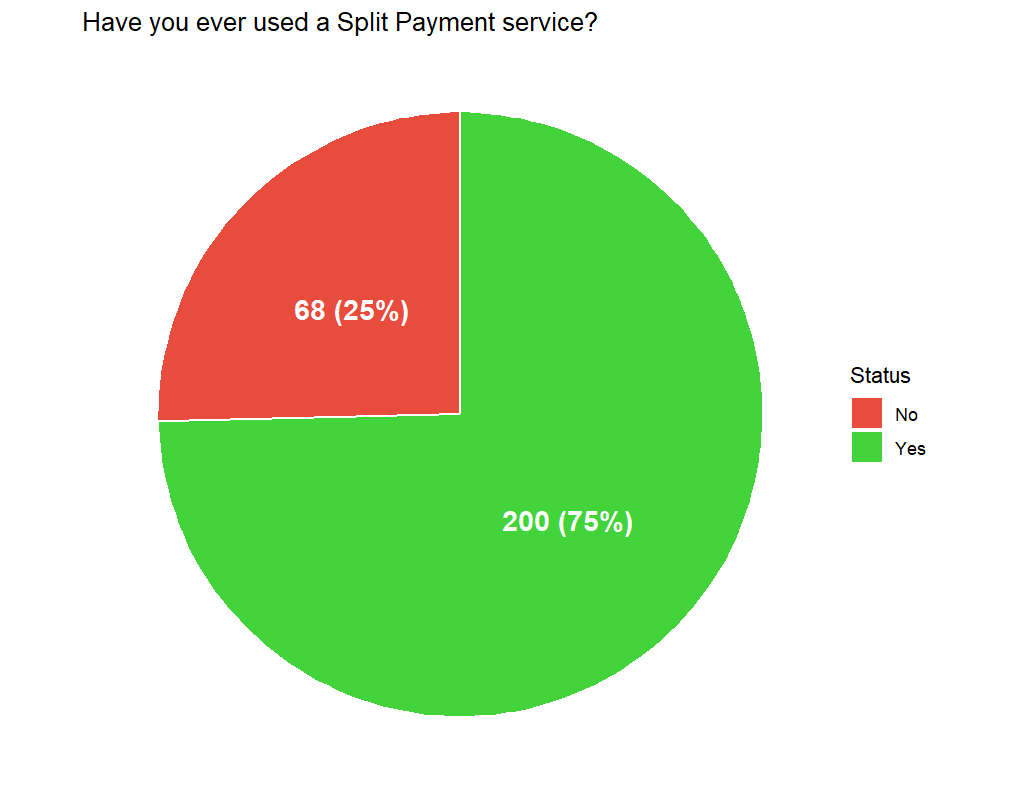
It is apparent that it is a viable, considered option for users, proved by this massive adoption of this service. As a user myself, I wanted to know what drives people to use them as a payment option.
From this point going forward, all further analysis is done on actual users, that is 200 out of the 268 respondents.

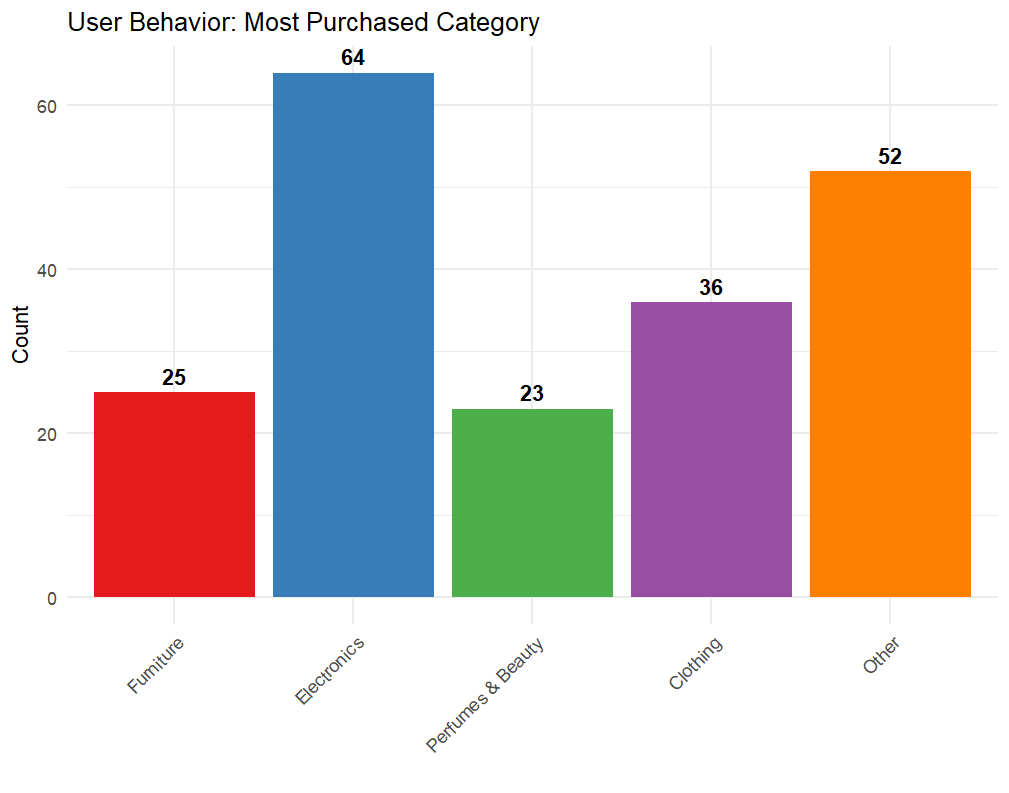

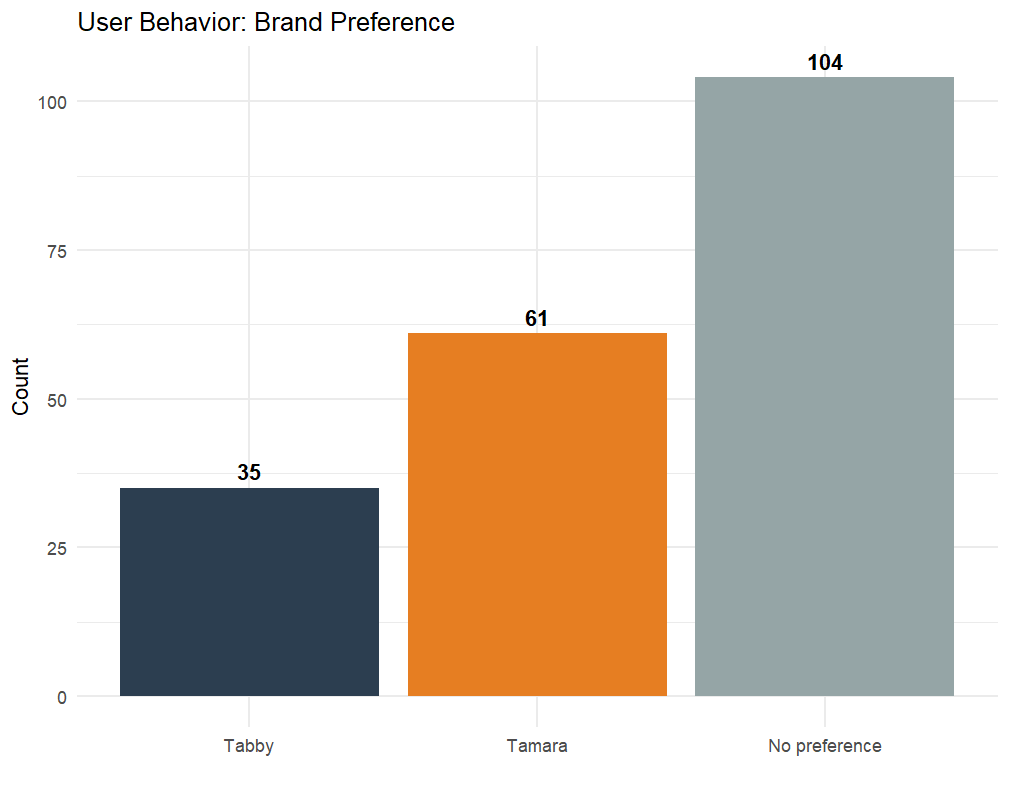
As we can tell from these charts, most users fall within the 18–34 age group, use split payment services once or twice a year or once every three months, and have no clear preference between service providers, assuming that users choose whatever is available for comfort.
Descriptive Statistics
To better understand these numbers, all answers were taken based on a 4-point Likert scale with no neutral option (1 = Strongly Disagree, 2 = Disagree, 3 = Agree, 4 = Strongly Agree). The midpoint is 2.5, the higher the number, the more the variable represents the user (for example, a score above 2.5 means an impulsive user, and so on).
| Variable | Questions | Mean | Std. Dev. | Median |
|---|---|---|---|---|
| Impulsivity | Q6 – Q10 | 2.62 | 0.633 | 2.60 |
| Financial Literacy | Q11 – Q15 | 3.33 | 0.562 | 3.40 |
| Liquidity Motive | Q16 – Q19 | 3.03 | 0.563 | 3.00 |
| Trust Score | Q20 – Q22 | 2.84 | 0.662 | 3.00 |
Users claim to be financially literate as their score (3.33/4.00) average is high, while other variables sit in agreement with the midpoint.
Is trusting split payments making you more impulsive?
Impulsivity and Trust score are borderline strongly correlated (r = 0.57). Looking at this table reveals an interesting insight: Financial Literacy and Impulsivity are NOT related (r = −0.08), which means a financially literate person can also be an impulsive buyer.
| Variable | Impulsivity | Financial Literacy | Liquidity Motive | Trust Score |
|---|---|---|---|---|
| Impulsivity | 1.000 | −0.078 | 0.513 | 0.573 |
| Financial Literacy | 1.000 | 0.339 | 0.172 | |
| Liquidity Motive | 1.000 | 0.466 | ||
| Trust Score | 1.000 |
The correlation matrix is written without the lower diagonal to make it easier to read and distinguish between relationships.
What increases Financial Literacy?
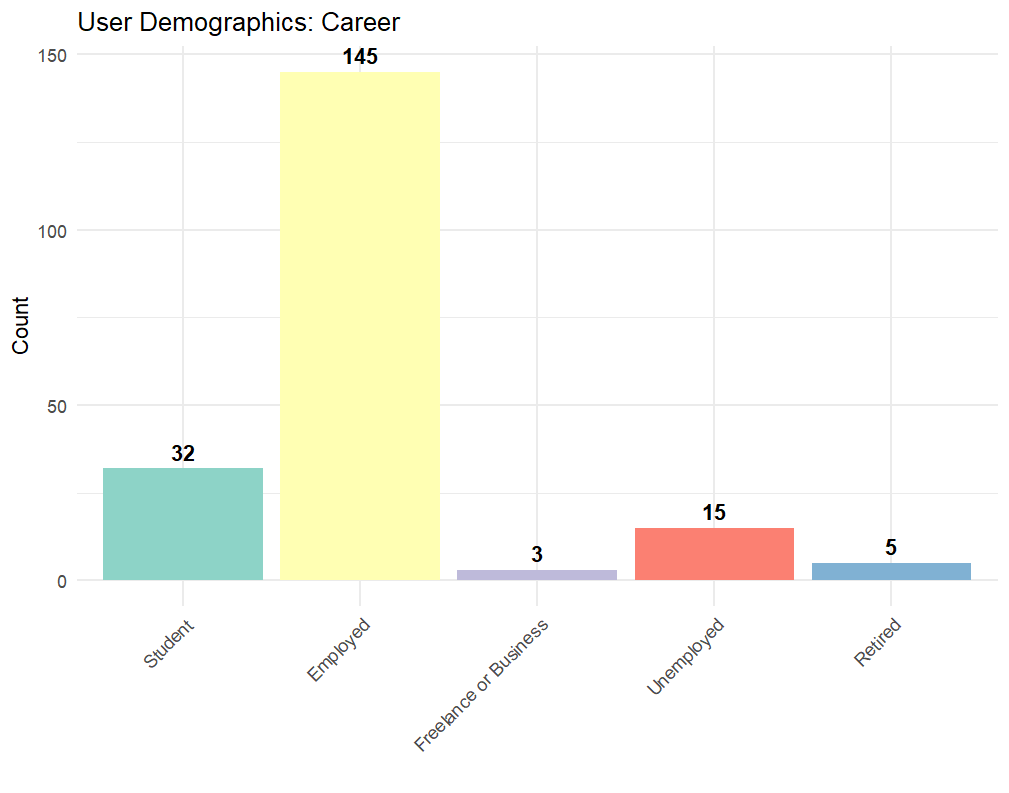
I tested for differences between groups using ANOVA, and which groups are different using Tukey post-hoc, and found that financial literacy differs significantly across career groups (F = 3.22, p = 0.014). Along with a highly educated sample (mostly Diploma & Bachelor's holders), education level alone doesn't explain the gap. Employment does.

Where was the most significant difference?
I would have guessed Unemployed and Employed users would have the biggest gap, and I would have guessed wrong.
Employed users score 0.36 points higher in Financial Literacy than students (3.41 vs. 3.05). Tukey post-hoc confirms this is the only significant pairwise difference (p = 0.009).
Does he spend more than she does?
While 72.5% of the sample were male users, none of the four variables tested with t-tests showed a significant p-value, meaning that men and women are pretty much the same when it comes to the four variables. Although women scored slightly higher on Impulsivity, it was not enough to matter statistically.

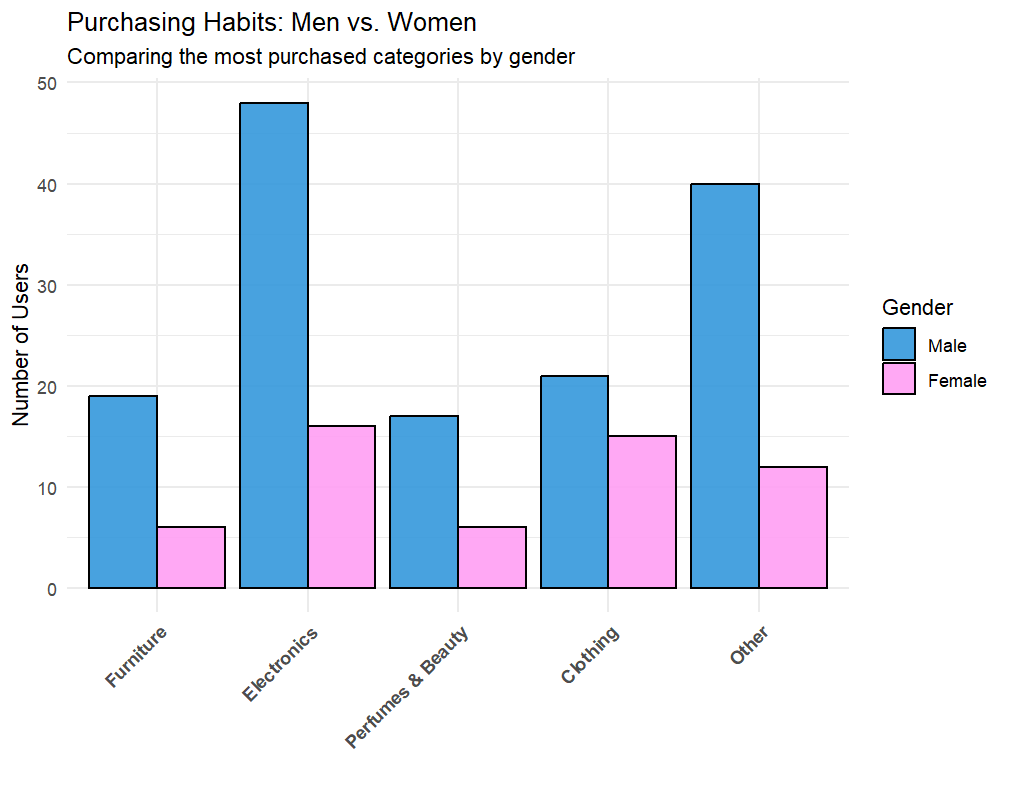
| Variable | Male | Female | p-value |
|---|---|---|---|
| Impulsivity | 2.575 | 2.749 | 0.075 |
| Financial Literacy | 3.364 | 3.240 | 0.168 |
| Liquidity | 3.060 | 2.950 | 0.203 |
| Trust | 2.818 | 2.909 | 0.372 |
Income and Financial Literacy
Now this must be common sense, right?.. right?
That's another incorrect guess you get to make with me. Income predicts Financial Literacy, but backwards (p = 0.006). Middle-income earners (5,000–10,000 SAR) score the highest, and the top earners, those who earn more than 20,000 SAR a month, actually score the lowest. Tukey confirms the gap between these two groups is significant (p = 0.019).
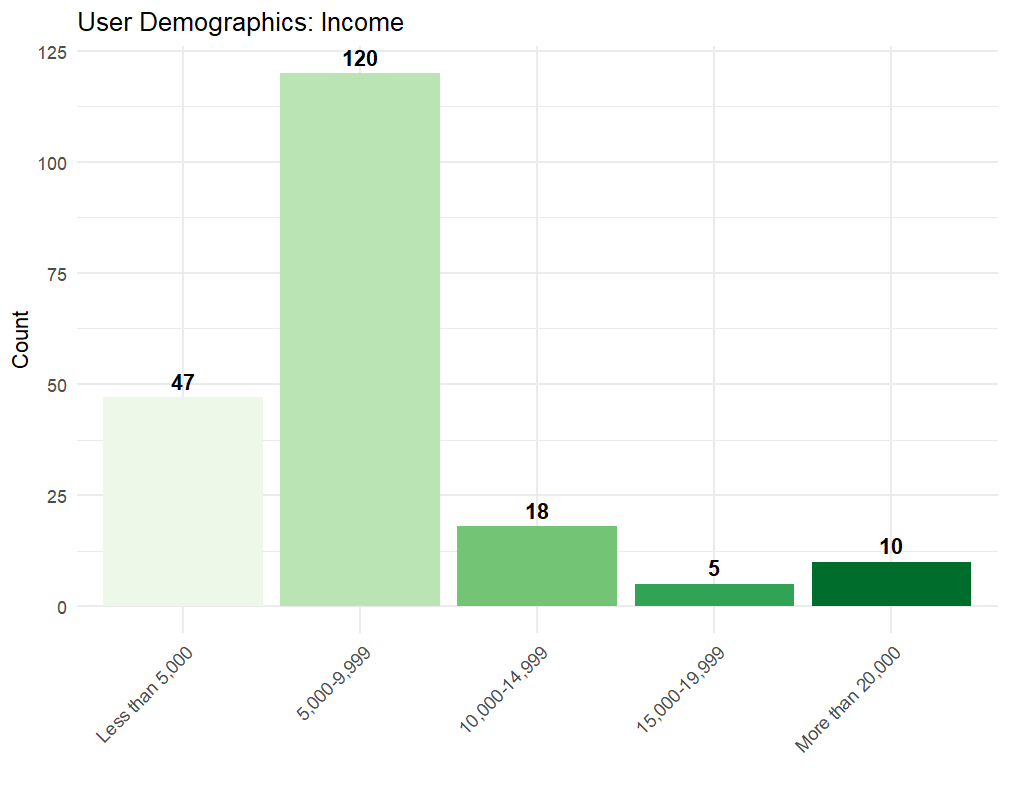
| Income (SAR/month) | Financial Literacy Mean | Std. Dev. | n |
|---|---|---|---|
| Less than 5,000 | 3.19 | 0.530 | 47 |
| 5,000 – 9,999 | 3.44 | 0.527 | 120 |
| 10,000 – 14,999 | 3.27 | 0.703 | 18 |
| 15,000 – 19,999 | 3.24 | 0.639 | 5 |
| 20,000 or more | 2.88 | 0.518 | 10 |
The 5k–10k bracket also carries the most debt in absolute terms, but that's a size effect, not a behavioural one. They're simply the largest group (n = 120). Income did not significantly predict Trust (F = 1.70, p = 0.151).
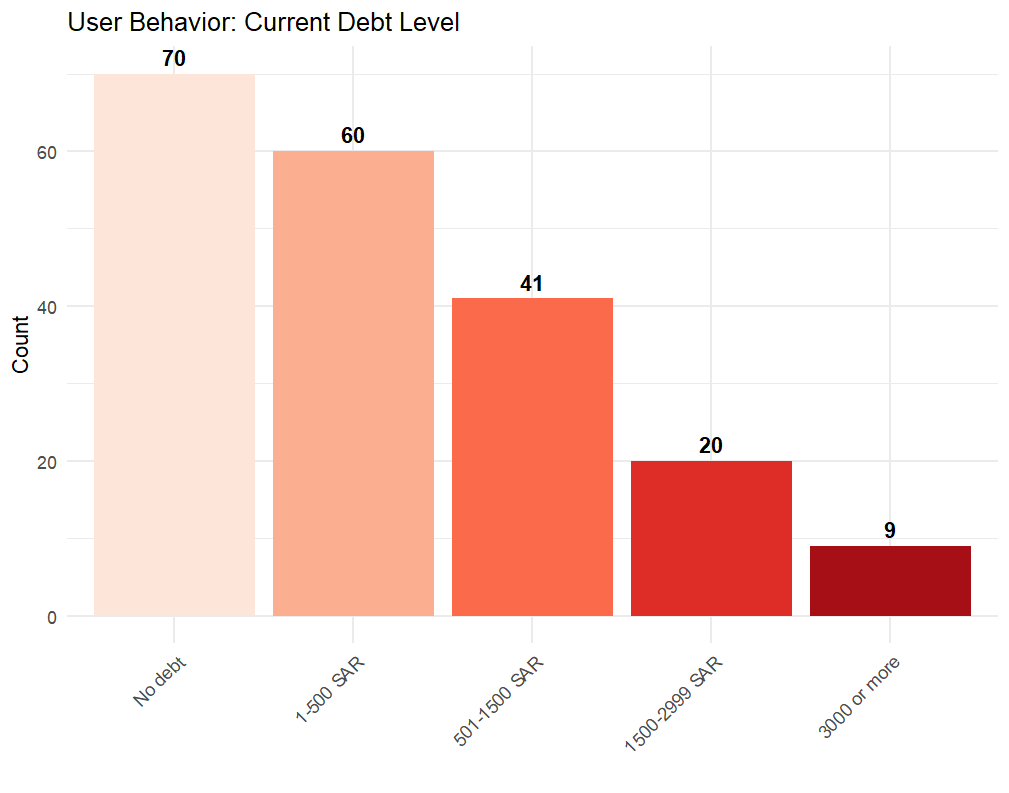

Defaulters vs Non-Defaulters
29 of the 200 users (14.5%) reported defaulting and being registered in Simah. So what separates them from the other 171?
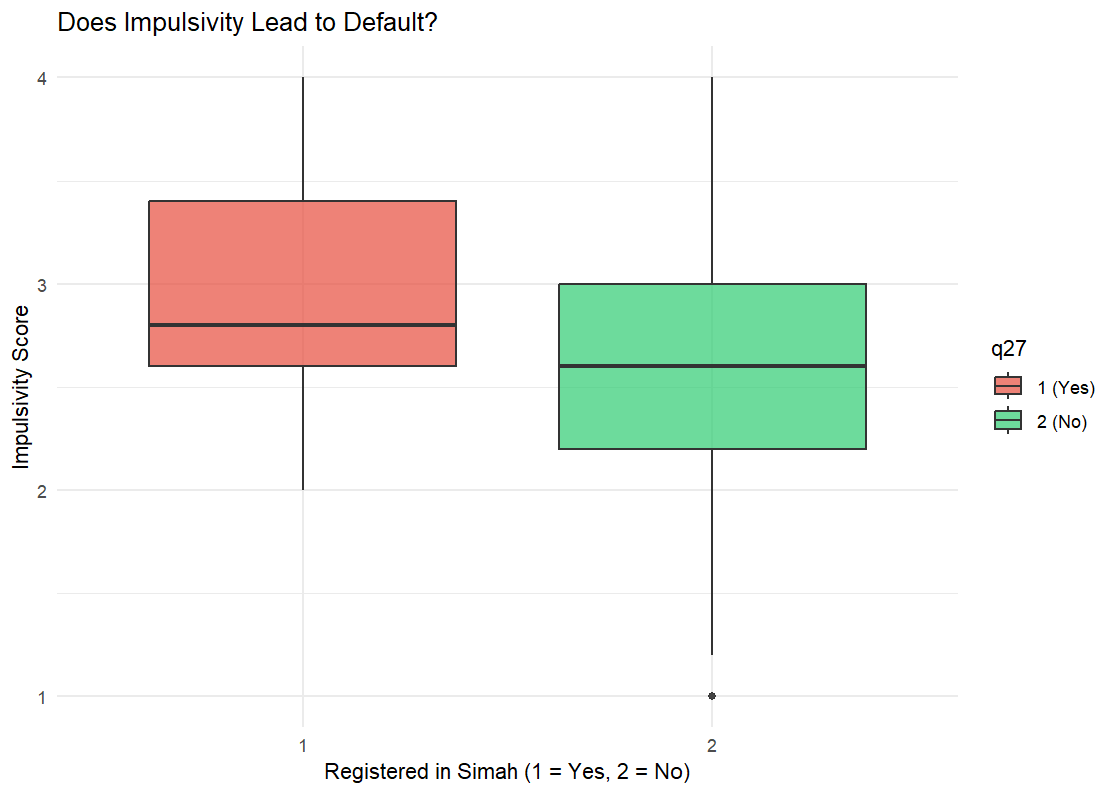
| Variable | Defaulters (n=29) | Non-Defaulters (n=171) | p-value |
|---|---|---|---|
| Impulsivity | 2.972 | 2.564 | < 0.001 |
| Financial Literacy | 3.214 | 3.350 | 0.238 |
| Liquidity | 3.198 | 3.001 | 0.098 |
| Trust | 3.011 | 2.815 | 0.123 |
Every unit increase in Impulsivity makes you 2.79× more likely to end up in Simah. Financial Literacy, Liquidity, and Trust are all non-significant, only Impulsivity matters when it comes to ending up in Simah or not.
Conclusion
Split payments are a double-edged sword. Most people use them purely out of impulse, but those who are financially literate can integrate them into their finances cleverly. The app doesn't make you reckless, it amplifies who you already are.
Technical Notes
All constructs used a 4-point forced-choice Likert scale (no neutral; midpoint = 2.5). Residual normality was violated in all four models, expected with Likert composites, and manageable at n = 200 via CLT. No model violated homoscedasticity (Breusch-Pagan p > 0.72 across all). ANOVA post-hoc used Tukey HSD.
Limitations: Convenience sample of 200 users from 268 total respondents. 68 non-users excluded, Likert items were inapplicable to them. Do not generalise.