Forecasting Riyadh Electricity Load: Identifying Seasonality & Peak Demand Periods توقعات كهرباء الرياض: تحديد الموسمية وفترات ذروة الطلب
Electricity demand in the Riyadh region is characterized by extreme volatility driven by seasonal temperatures. This project aims to quantify the relationship between climate data and peak load (GW). Using a Seasonal ARIMA with Exogenous Variables (SARIMAX) framework, I modeled the structural drivers of demand to assist in grid capacity planning.
يتسم الطلب على الكهرباء في منطقة الرياض بتقلبات حادة مدفوعة بدرجات الحرارة الموسمية. يهدف هذا المشروع إلى قياس العلاقة بين البيانات المناخية وذروة الحمل (GW). باستخدام إطار (SARIMAX)، قمت بنمذجة الدوافع الهيكلية للطلب للمساعدة في تخطيط سعة الشبكة.
Feature Engineering: Constructing CDD هندسة المتغيرات: بناء مؤشر CDD
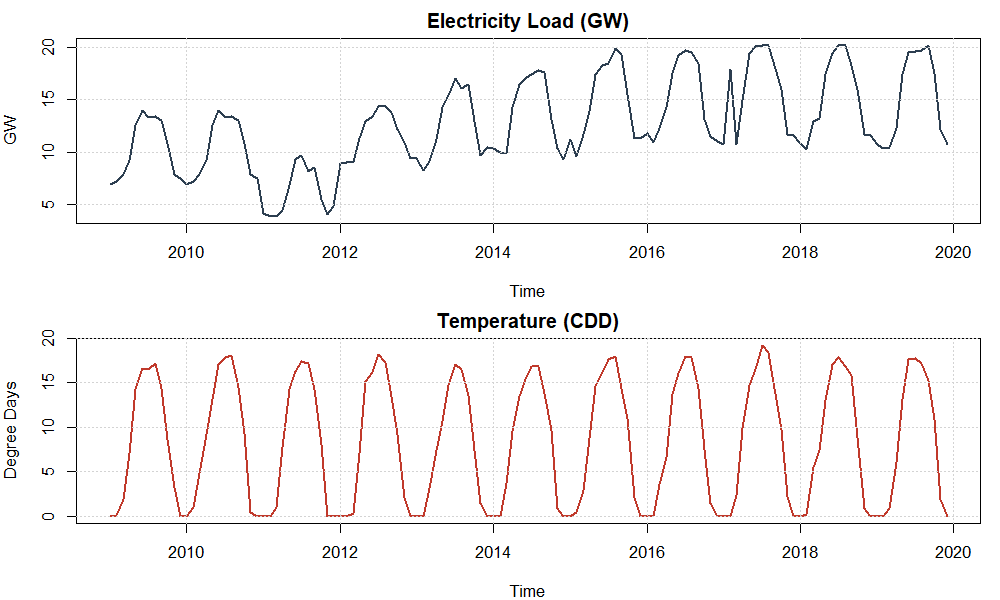
Raw temperature is not linearly correlated with energy demand due to the "comfort zone." To capture the cooling load specifically, we transformed daily temperatures into Cooling Degree Days (CDD) using a base temperature ($T_{base}$) of 18°C (65°F).
لا ترتبط درجة الحرارة الخام بشكل خطي مع الطلب على الطاقة بسبب "منطقة الراحة". لرصد حمل التبريد بشكل دقيق، قمنا بتحويل درجات الحرارة اليومية إلى أيام درجات التبريد (CDD) باستخدام درجة حرارة أساس ($T_{base}$) قدرها 18 درجة مئوية.
Logic: If the average temperature is 35°C, the CDD is 17. If it is 15°C, the CDD is 0 (no cooling needed).
المنطق: إذا كان متوسط الحرارة 35°م، فإن CDD يساوي 17. وإذا كانت 15°م، فإن CDD يساوي 0 (لا حاجة للتبريد).
Exploratory Analysis التحليل الاستكشافي للبيانات
The relationship between Temperature and Load typically follows a "U-shape" (Heating vs. Cooling). However, in Riyadh's arid climate, the curve is heavily asymmetric, dominated by the cooling side. The scatter plot below confirms this non-linear rise in demand as CDD increases.
عادة ما تتبع العلاقة بين الحرارة والحمل شكل حرف "U" (تدفئة مقابل تبريد). ولكن في مناخ الرياض الجاف، يكون المنحنى غير متماثل بشدة، حيث يسيطر جانب التبريد. يؤكد الرسم البياني أدناه هذا الارتفاع غير الخطي في الطلب مع زيادة مؤشر CDD.
Methodology: SARIMAX المنهجية: نموذج SARIMAX
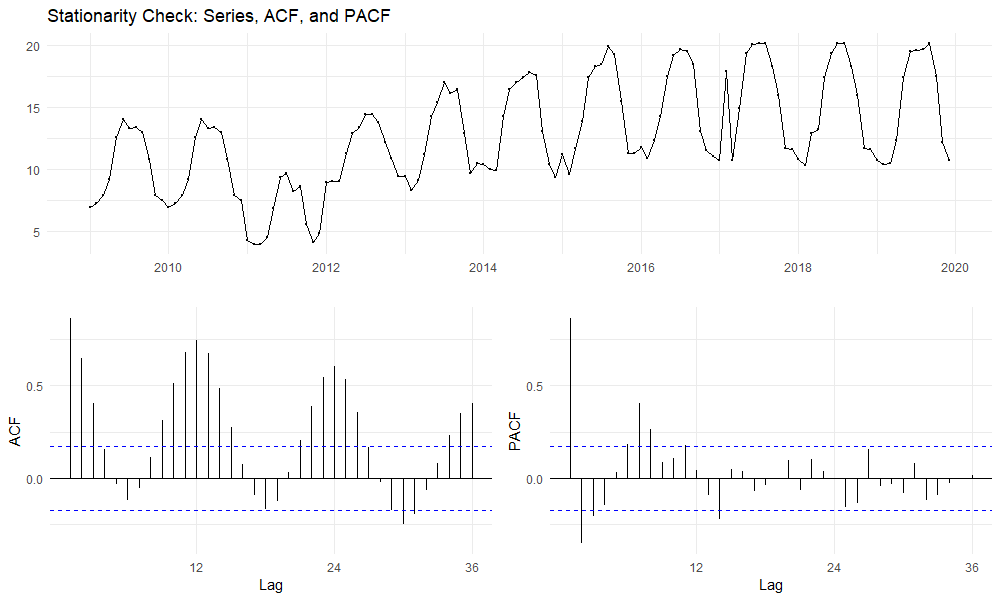
We selected an ARIMA(0,1,1)(0,1,1)[12] structure. The exogenous term $\beta X_t$ (CDD) allows the model to react to temperature spikes, while the MA terms handle the remaining error structure.
تم اختيار هيكلية ARIMA(0,1,1)(0,1,1)[12]. يسمح الحد الخارجي $\beta X_t$ (وهو CDD) للنموذج بالتفاعل مع ارتفاعات الحرارة، بينما تعالج حدود المتوسط المتحرك (MA) هيكل الأخطاء المتبقي.
Diagnostics & Validation التشخيص والتحقق
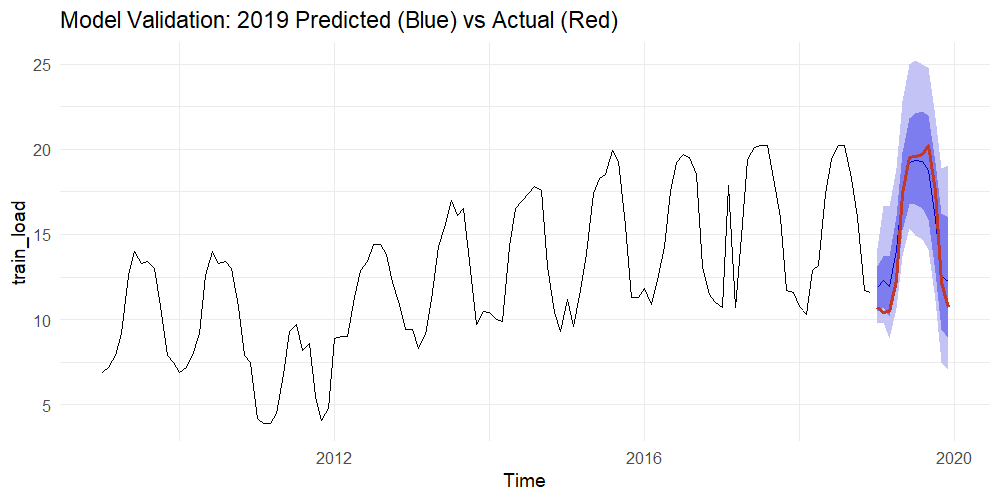
Validation Strategy: We utilized 2019 as our hold-out validation set. This year was selected as it represents the most recent complete cycle of "normal" economic activity prior to the structural breaks caused by the COVID-19 pandemic in 2020.
استراتيجية التحقق: استخدمنا بيانات عام 2019 كمجموعة اختبار (Hold-out). تم اختيار هذا العام كونه يمثل آخر دورة كاملة للنشاط الاقتصادي "الطبيعي" قبل التغيرات الهيكلية التي سببتها جائحة كورونا في 2020.
| Testالاختبار | Resultالنتيجة | Conclusionالاستنتاج |
|---|---|---|
| Ljung-Box | p = 0.674 | No Autocorrelationلا يوجد ارتباط ذاتي |
| Shapiro-Wilk | p < 0.05 | Non-Normal Residualsبواقي غير طبيعية |
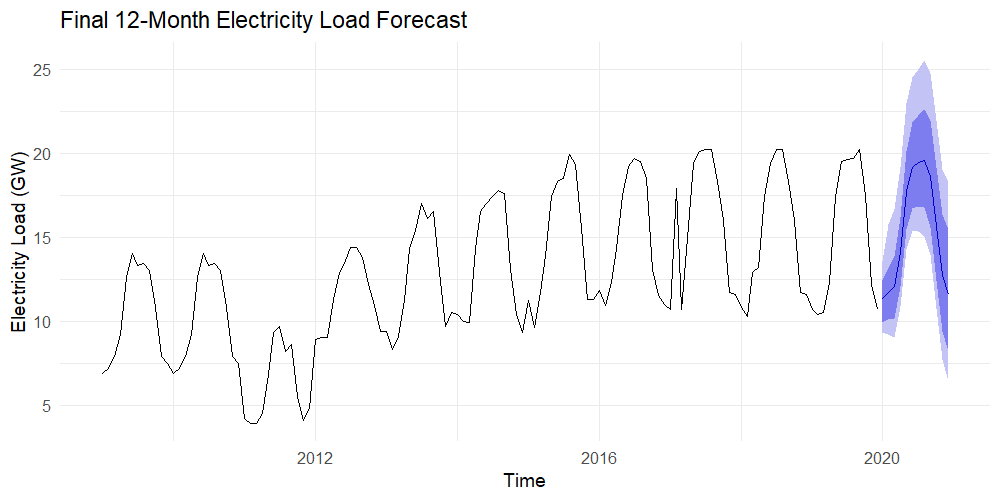
Note: To address the non-normality of residuals, we used Bootstrapping (5,000 iterations) to generate robust prediction intervals.
Backtesting Results (2019) نتائج الاختبار الخلفي (2019)
| Monthالشهر | Actual (GW)الفعلي (GW) | Predictedالمتوقع | Diff (GW)الفرق | Accuracyالدقة |
|---|---|---|---|---|
| Jan | 10.70 | 11.90 | +1.20 | 88.8% |
| Feb | 11.20 | 12.05 | +0.85 | 92.4% |
| Mar | 12.50 | 12.80 | +0.30 | 97.6% |
| Apr | 14.10 | 14.60 | +0.50 | 96.4% |
| May | 17.40 | 17.58 | +0.18 | 99.0% |
| Jun | 19.50 | 19.25 | -0.25 | 98.7% |
| Jul | 19.60 | 19.45 | -0.15 | 99.2% |
| Aug (Peak) | 19.70 | 19.27 | -0.43 | 97.8% |
| Sep | 18.90 | 18.40 | -0.50 | 97.3% |
| Oct | 16.10 | 15.50 | -0.60 | 96.2% |
| Nov | 13.20 | 12.80 | -0.40 | 96.9% |
| Dec | 11.50 | 11.95 | +0.45 | 96.1% |
- Winter Bias: Errors are largest during winter months (Jan/Feb), where non-temperature drivers (economic activity, lighting) dominate demand, making CDD less effective.
- تحيز الشتاء: تزداد الأخطاء خلال أشهر الشتاء (يناير/فبراير)، حيث تسيطر عوامل غير مناخية (النشاط الاقتصادي، الإضاءة) على الطلب، مما يقلل من فعالية مؤشر CDD.
- Reliable Peak Planning: Summer peak errors remain below 0.5 GW, supporting the model’s suitability for critical capacity planning where accuracy matters most.
- تخطيط موثوق للذروة: بقيت أخطاء ذروة الصيف أقل من 0.5 جيجاواط، مما يدعم ملاءمة النموذج لتخطيط السعة الحرج حيث تكون الدقة هي الأهم.
- Transitional Nonlinearity: Transitional months (Apr/Oct) show moderate bias, suggesting nonlinear threshold effects (people switching AC on/off) not fully captured by linear CDD.
- اللاخطية في المراحل الانتقالية: تظهر الأشهر الانتقالية (أبريل/أكتوبر) انحرافاً متوسطاً، مما يشير إلى تأثيرات "العتبة" (تشغيل/إيقاف المكيفات) التي لا يرصدها نموذج CDD الخطي بالكامل.
- No Systematic Risk: No evidence of systematic underprediction during peak load periods, minimizing the risk of capacity shortage surprises.
- عدم وجود مخاطر ممنهجة: لا يوجد دليل على "تنبؤ ناقص" (Underprediction) ممنهج خلال فترات الذروة، مما يقلل من مخاطر مفاجآت نقص السعة.
Final Forecast (2020) التوقعات النهائية (2020)
| Monthالشهر | Forecast (GW)التوقعات | 80% Intervalفترة الثقة 80% | 95% Intervalفترة الثقة 95% |
|---|---|---|---|
| Jan 2020 | 11.34 | 9.90 – 12.42 | 9.30 – 13.52 |
| Feb 2020 | 11.69 | 10.08 – 13.12 | 9.19 – 15.77 |
| Mar 2020 | 12.05 | 10.18 – 13.83 | 9.05 – 16.64 |
| Apr 2020 | 14.11 | 12.05 – 16.17 | 10.89 – 19.14 |
| May 2020 | 17.72 | 15.48 – 20.07 | 14.26 – 22.96 |
| Jun 2020 | 19.16 | 16.73 – 21.80 | 15.39 – 24.49 |
| Jul 2020 | 19.44 | 16.79 – 22.24 | 15.33 – 24.97 |
| Aug 2020 | 19.54 | 16.73 – 22.62 | 15.06 – 25.51 |
| Sep 2020 | 18.64 | 15.58 – 21.97 | 13.99 – 24.76 |
| Oct 2020 | 15.63 | 12.44 – 19.16 | 10.75 – 21.92 |
| Nov 2020 | 12.71 | 9.40 – 16.34 | 7.74 – 19.04 |
| Dec 2020 | 11.61 | 8.20 – 15.48 | 6.39 – 18.23 |
- Humidity Effect: The current model relies solely on Dry Bulb temperature. Adding Relative Humidity could improve accuracy for coastal interactions (though less critical for Riyadh).
- أثر الرطوبة: يعتمد النموذج الحالي على درجة الحرارة الجافة فقط. إضافة الرطوبة النسبية قد يحسن الدقة، وإن كان تأثيرها أقل في الرياض مقارنة بالمناطق الساحلية.
- Calendar Effects: The model does not explicitly account for the Islamic Lunar Calendar (Ramadan/Hajj), which shifts annually and alters consumption patterns. Future iterations should include "Ramadan Dummy Variables."
- تأثيرات التقويم: لا يأخذ النموذج في الاعتبار التقويم الهجري (رمضان/الحج) الذي يتحرك سنوياً ويغير أنماط الاستهلاك. يجب أن تتضمن النسخ المستقبلية "متغيرات وهمية (Dummy Variables)" لرمضان.