Study and Analysis of Economic Factors Affecting Inflation in Saudi Arabia: Using the ARDL Methodology
Introduction and Key Definitions
Inflation is a key indicator of macroeconomic stability with a direct impact on purchasing power and growth. The Saudi economy has a unique relationship with inflation given its heavy reliance on oil revenues. With the structural transformation led by Vision 2030, new variables have emerged that shape price dynamics.
The Research Problem
Despite the critical importance of controlling inflation, the factors driving it within Saudi Arabia show varying impacts that shift with domestic and global conditions. Two main issues frame this study.
Uncertainty in Macroeconomic Impacts: It is unclear how strongly and in which direction variables like oil prices, money supply, GDP, and trade openness affect Saudi prices, especially as global conditions change.
The Vision 2030 Structural Shift: The reforms launched in 2016, including VAT and energy subsidy removal, introduced a new pricing dynamic that earlier studies have not fully captured.
Research Hypotheses
- H1: There is a significant relationship between Saudi inflation and the variables: M2, GDP, Oil Prices, Trade Openness, and Vision 2030.
- H2: Money Supply (M2) significantly affects inflation in both the short and long run.
- H3: GDP significantly affects inflation in both the short and long run.
- H4: Oil prices significantly affect inflation in both the short and long run.
- H5: Trade openness significantly affects inflation in both the short and long run.
- H6: Vision 2030 significantly affects inflation.
Study Variables Over Time
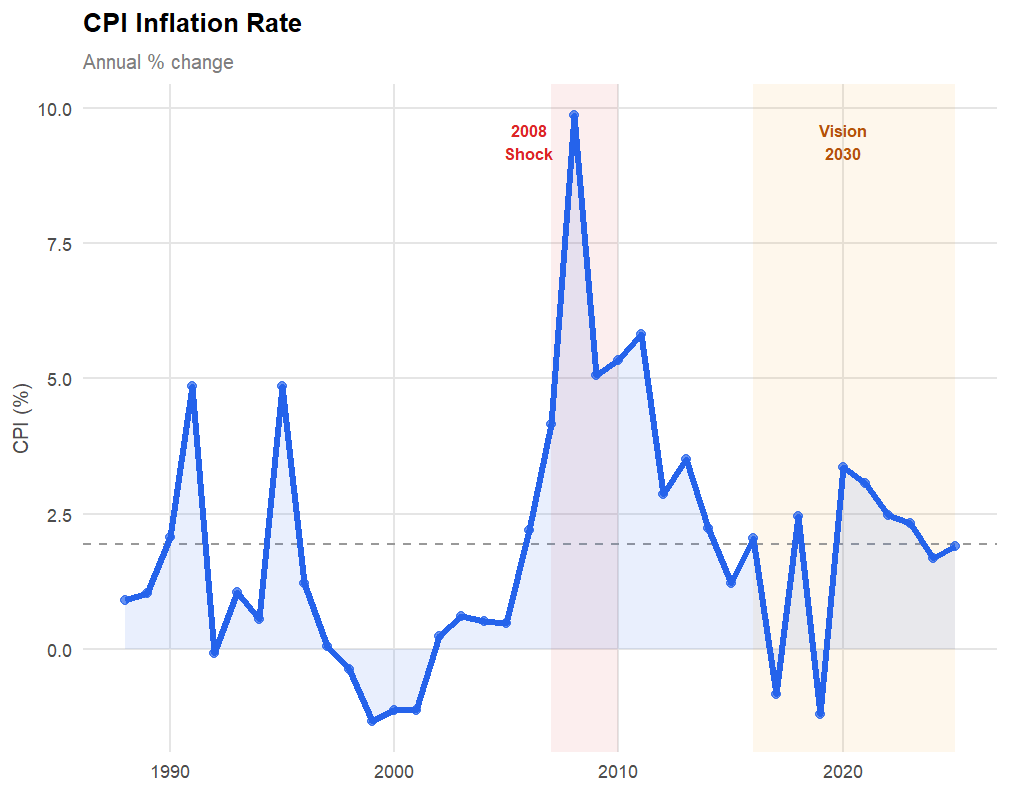
Figure 1: Annual CPI inflation rate in Saudi Arabia (1988-2025). Red shading = 2008 oil shock. Orange shading = Vision 2030 era from 2016.

Figure 2: Saudi Arabia nominal GDP in billion USD (1988-2025).

Figure 3: Broad Money Supply (M2) in billion USD (1988-2025).

Figure 4: Arabian Light crude oil price in USD per barrel (1988-2025).
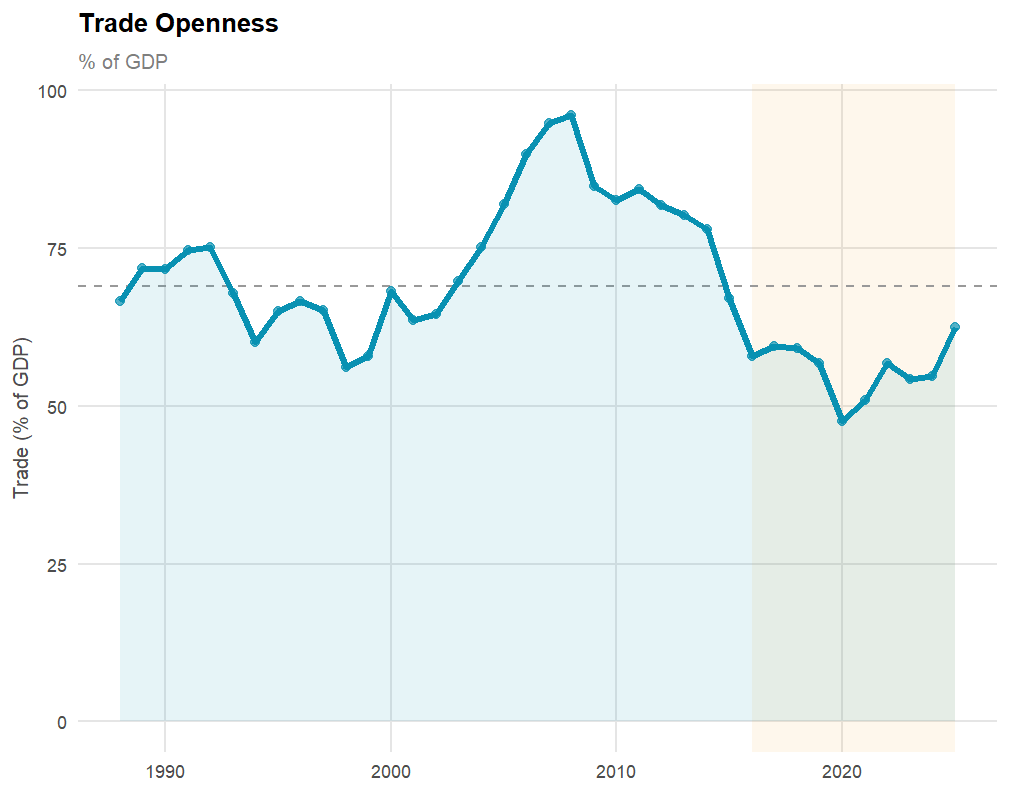
Figure 5: Trade openness as a percentage of GDP in Saudi Arabia (1988-2025).
Analysis and Testing
Why ARDL?
ARDL was chosen because it does not require all variables to be integrated at the same order, it works with small samples, and it estimates long-run and short-run relationships in one equation. The only requirement is that no variable is integrated of order two.
The Model
Lag order ARDL(1,2,0,1,0) was selected using BIC to avoid over-fitting given the sample of 38 annual observations. Vision 2030 is treated as exogenous.
Unit Root Tests
Phillips-Perron tests confirm CPI is stationary at the level I(0), while lnGDP, lnM2, lnOil, and lnTrade are stationary after first differencing I(1). No variable is I(2), satisfying the requirement for ARDL bounds testing.
Bounds Cointegration Test
The F-statistic of 5.355 exceeds the upper I(1) critical bound of 4.630 at the 5% level (p = 0.025). This confirms a stable long-run relationship between Saudi CPI and its determinants.
UECM Estimates

Figure 6: Unrestricted Error Correction Model (UECM) coefficient estimates.
Restricted ECM Estimates

Figure 7: Restricted ECM estimates. ECT = -0.794 (p < 0.001), confirming 79.4% annual adjustment toward equilibrium.
Diagnostic Tests
The model passes all key diagnostic checks: no serial correlation (BG test, p = 0.165), constant variance (Breusch-Pagan, p = 0.995), correct functional form (Ramsey RESET, p = 0.187), and structural stability (CUSUM within bounds throughout 1988-2025). Residual normality is rejected due to three identifiable shock years: 1995, 2008, and 2020. This does not invalidate the results.

Figure 8: Residual diagnostic plots. The three outlier spikes correspond to the 1995 fiscal expansion, the 2008 oil shock, and the 2020 COVID-19 pandemic.

Figure 9: Recursive CUSUM test. The blue line stays within the red critical bounds throughout the full sample, confirming parameter stability.
Results
Short-Run
Lagged GDP growth significantly dampens current CPI (coefficient = -9.502, p = 0.002), consistent with supply expansion easing price pressures. Short-run oil price changes are not significant (p = 0.412), consistent with domestic subsidies shielding consumers from global energy shocks. Vision 2030 is the strongest short-run driver (coefficient = 4.585, p < 0.001), capturing the immediate price impact of VAT and subsidy removal.
Long-Run
Vision 2030 is the only significant long-run determinant at the 5% level, associated with a permanent upward shift of approximately 5.77 percentage points in equilibrium CPI. GDP, M2, oil prices, and trade are individually insignificant in the long run, which is common in small annual samples with wide confidence intervals.
Speed of Adjustment
The ECT of -0.794 is highly significant (p < 0.001). This means 79.4% of any short-run deviation from equilibrium is corrected within one year, consistent with SAMA's active monetary management.
Hypothesis Results
- H1: Supported. The model is jointly significant (F = 8.265, p < 0.001) with confirmed long-run cointegration.
- H2: Not supported. M2 is insignificant in both the short and long run, likely because the riyal-dollar peg limits SAMA's independent monetary influence.
- H3: Partially supported. GDP is significant in the short run only (p = 0.002), not in the long run.
- H4: Not supported. Oil prices are insignificant at the 5% level in both horizons, suggesting government subsidies absorb global price shocks.
- H5: Not supported. Trade openness is insignificant, likely because the dollar peg anchors import prices regardless of trade volume.
- H6: Partially supported. Vision 2030 is the dominant driver in both the short run (p < 0.001) and the long run (estimated shift of 5.77pp), though the long-run multiplier should be read with caution given the sample size.
In-Sample Validation
The model achieves RMSE = 1.532 and MAE = 1.106 percentage points. It fits well in stable years, with errors below 0.5pp in several recent years. The three largest errors occur in 1995, 2008, and 2020 due to identifiable external shocks, not model misspecification.

Figure 10: In-sample fit, actual vs predicted CPI (1990-2025). RMSE = 1.532 | MAE = 1.106.
ARDL Point Forecast (2026-2030)
Regressor forecasts were generated using R's auto.arima on each variable, then fed into the ARDL levels equation. GDP was modelled as a random walk (ARIMA(0,1,0)), producing a flat trajectory that drives CPI toward near-zero and into mild deflation by 2030. This should be read as a lower-bound baseline, not a definitive prediction.
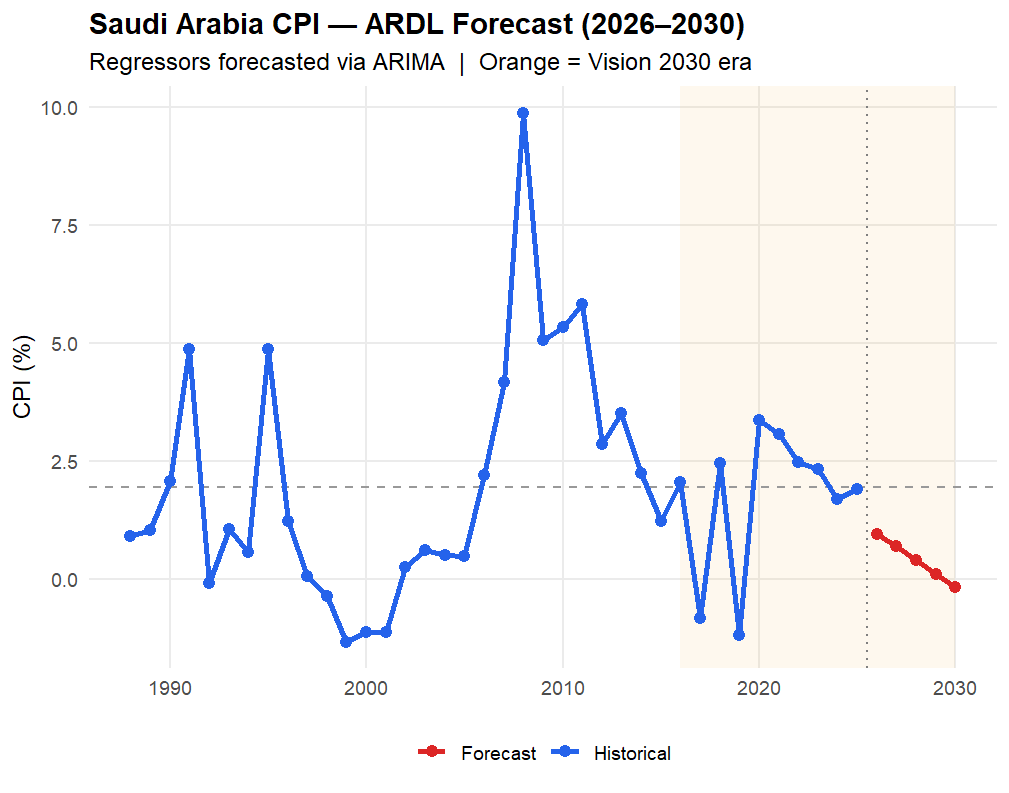
Figure 11: Saudi Arabia CPI, ARDL point forecast (2026-2030). Orange shading = Vision 2030 era.
Monte Carlo Simulation
A point forecast gives a single line that hides how uncertain the future actually is. The Monte Carlo simulation runs 10,000 versions of the forecast, each with slightly different coefficient values and regressor paths drawn from their estimated distributions. The result is a fan chart showing the range of plausible outcomes rather than one fixed line.
Each simulation draws a correlated set of ARDL coefficients from a multivariate normal distribution using the full OLS covariance matrix, and simultaneously perturbs the regressor forecasts using the ARIMA standard errors. Residual noise is added at each step using the model RSE of 1.802. The ARDL levels equation is then iterated forward year by year for each simulation.

Figure 12: Left, ARDL forecast with Monte Carlo uncertainty bands (50%, 80%, 95% CI). Right, distribution of simulated 2030 CPI across 10,000 runs.
By 2030, the simulation gives a 49.6% probability of deflation, 27.1% probability of inflation above 3%, and a median near zero (0.04%). The wide bands spanning roughly 22 percentage points at the 95% level reflect the uncertainty of a 38-observation sample with five years of compounding forecast error. This is not a weakness of the model but an honest representation of what the data can and cannot tell us.
Forecast Comparison
The two forecasts use the same ARDL model but differ in one input: how GDP is projected. R's auto.arima selected ARIMA(0,1,0), a random walk that assumes no trend going forward. Python's auto_arima selected ARIMA(2,1,0), which picks up Saudi GDP's recent upward momentum and produces slightly higher CPI forecasts throughout the horizon.
| Year | ARDL Point Forecast (R) | Monte Carlo Median (Python) | 95% Confidence Interval |
|---|---|---|---|
| 2026 | 0.95% | 1.24% | -3.52% to 6.32% |
| 2027 | 0.67% | 0.50% | -7.50% to 7.60% |
| 2028 | 0.38% | 0.49% | -9.77% to 9.01% |
| 2029 | 0.10% | 0.28% | -10.98% to 9.53% |
| 2030 | -0.18% | 0.04% | -12.16% to 9.75% |
Both forecasts agree on the direction: CPI declining toward near-zero by 2030. The R point forecast of -0.18% sits well within the Monte Carlo 50% confidence interval, so the two approaches are statistically consistent. The main message from the fan chart is that any single number for 2030 CPI represents false precision. Given the sample size and the uncertainty in regressor forecasts, a range is more honest than a point estimate.
Limitations
- 38 annual observations is a small sample, producing wide coefficient confidence intervals and wide Monte Carlo bands.
- Residual normality fails due to three shock years (1995, 2008, 2020). Adding impulse dummies would improve this.
- The five-year forecast cannot incorporate planned Vision 2030 spending, making it a lower-bound baseline.
- Monte Carlo bands widen to over 20 percentage points by 2030 due to compounding uncertainty across five forecast steps.